
Gotta love being a manager, especially at small or medium-size library. Most days, I’m so exhausted I can’t even come up with a clever metaphor to illustrate how exhausted I am. With demand for library services surging, and the demand for materials slowing down, it’s hard to justify spending time on the collection. But we still want good circulation numbers, and luckily, collectionHQ has many tools to make our jobs easier.
Twinsburg Library has been a subscriber since 2012. I am lucky to have a lot of data to draw from when I’m analyzing performance history. But even if you are a new subscriber, there are some great tools to start off with.
Cari’s Easy Guide to Monitoring Collection Performance
- Make sure you run Collection Check at least once a year. This report catches items that haven’t circulated in more than four years. This will ensure that you don’t have super-dead items lingering on your shelves. You might also catch missing items. One year, we found hundreds of old magazine barcodes that were long gone, but hadn’t been purged from our system.
- Use the Scheduling module to create a weeding schedule for each staff member. Hold them accountable; we tie it to their yearly evaluation. We allow staff to decide when they weed, but they must run a Dead report and a Grubby report on each section twice per year.
- Do a “beauty check” when you are out in the stacks pulling holds or finding books for patrons. Do you have sections that just look ugly? Do you have books that are checking out and are under 40 circulations, but are still more than 10 years old? You can also delegate this task to the staff members responsible for their areas.
- Create your own customized Dashboard. From the main Dashboard, click on the + button on any chart you want to add:
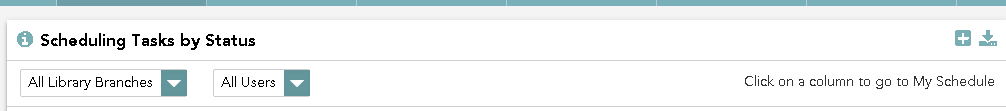
Once you’ve saved your favorite reports, you can click on “My Dashboard” to see them:
My favorite reports are:
Dead on Arrival – This report shows which items are brand new, but haven’t been checked out in a year, or have been checked out once in a year. You can break down the report to show different collections – Fiction, Non-Fiction, or different age levels. I like to exclude periodicals since those don’t often have as many checkouts. We pull the titles that aren’t checking out and put them on a display.
Dead/Grubby Percentages – These reports let me eyeball our Dead and Grubby percentages and compare them to previous years. Since we’ve been working on reducing those percentages, I like to see that they are still under 10%, which is the collectionHQ standard.
Subject/Popular Author Provisioning – These charts tie back to the Popular Author Summary (for Fiction) and the Popular Subject Summary (for Non-Fiction). I can see at a glance when our authors and subjects are adequately provisioned. I can also drill down into the chart to see which areas need work, so I can suggest to selectors what they might want to purchase.
Circulation and Turnover – This report compares our raw circulation to previous years, and shows the turnover of our materials, which is the average amount of times an item in our collection circulates per year. So even if our overall circulation is down, we can see how our internal performance measures up. We are in a consortium, so anytime a new library joins, our circulation drops because there are more libraries to choose from. This chart helps us compare without taking that external factor into account.
I check my Dashboard every time there is a new dataset. Get into the habit of checking, and you’ll start to see patterns each month. Then, when you meet with your staff, you can check in with them on their work and how they’re coming along. You might even come to enjoy your monitoring! collectionHQ makes it colorful, easy, and fun.